Hydrogen bonding in Ethanol
Introduction
This notebook explains how to analyse a molecular dynamics trajectory and count and visualise the hydrogen bonds present.
The files to follow along with this are:
Hydrogen bonds are massively important in problems such as self assembly, and are formed between three atoms
- the acceptor, who forms a strong nonbonded interaction with…
- the hydrogen, who is connected via covalent bond to…
- the donor
We will use a definition of a Hydrogen-Acceptor distances of less than 3.0 Angstroms and a Acceptor-Hydrogen-Donor angle of greater than 130 degrees. We can therefore easily count and visualise the population of hydrogen bonds using simple geometry.
To do this we will use Python, and in particular the MDAnalysis package.
This will require version 0.10.0 or greater of MDAnalysis. The easiest way to get this is via PyPI
Getting started
To start with, we will create a Universe object. This is created from the .gro file from our Gromacs simulation, but could be made from practically any format of molecular dynamics simulation.
The “guess_bonds” keyword here tells MDAnalysis to guess the bonds between atoms when it loads the coordinates. This is necessary as gro files carry no record of the connectivity between atoms.
In [1]:
import MDAnalysis as mda

u = mda.Universe('eth.gro', guess_bonds=True)
The Universe object acts as the nexus of analysis we will perform. From this we will access information about the atoms, bonds and coordinates from our trajectory.
In [23]:
print u
print u.atoms
print u.bonds
print u.trajectory
<Universe with 13257 atoms and 11784 bonds>
<AtomGroup with 13257 atoms>
<TopologyGroup containing 11784 Bonds>
< GROReader 'eth.gro' with 1 frames of 13257 atoms (0 fixed) >
Selecting atoms
Firstly, we want to select some atoms, but I can’t remember what I called them. I can quickly check by looking at the set of the types and names of the atoms.
In [20]:
print set(u.atoms.names())
print set(u.atoms.types())
set(['1H2', '3H1', '1H1', 'OH', '2H1', '2H2', 'HO', 'C2', 'C1'])
set(['H', 'C', 'O'])
I can then select atoms based on their name. This creates an “AtomGroup”. This object holds an array of Atoms, and does many cool things…..
In [34]:
Hydrogens= u.selectAtoms('name HO')
print Hydrogens
<AtomGroup with 1473 atoms>
Among the many cool things AtomGroups can do, is provide the positions and velocities of the atoms. These are given as a numpy array.
In [33]:
print Hydrogens.positions
print
print Hydrogens.velocities
[[ 50.79000092 9.5 45.38000107]
[ 42.67000198 12.10999966 4.30999994]
[ 0.97999996 2.91000009 28.32999992]
...,
[ 15.55999947 51.40999603 32.42000198]
[ 1.41000009 41.45999908 18.71999931]
[ 5.36000013 49.27000046 50.87999725]]
[[ 13.48700047 12.28199959 -2.28699994]
[ -7.4989996 8.77300072 4.42400026]
[ 1.82200003 -12.46500015 11.04599953]
...,
[ 3.36299992 1.08899999 4.11500025]
[ 22.60099792 -4.78800011 8.12100029]
[ -2.07599998 -0.824 1.95700002]]
All OH atoms can be acceptors in hydrogen bonds, so we’ll create an AtomGroup of those too
In [29]:
Acceptors = u.selectAtoms('name OH')
print Acceptors
<AtomGroup with 1473 atoms>
We also want to have a group representing the donor for each hydrogen. For our system, this is identical to the selection of donors, but this is not true for all systems. A more correct way of making this selection is to use a list comprehension, choosing the first (and only) atom which is bonded to each hydrogen.
In [30]:
from MDAnalysis.core.AtomGroup import AtomGroup

Donors = AtomGroup([at.bonded_atoms[0] for at in Hydrogens])

print Donors
<AtomGroup with 1473 atoms>
Recap
At this point we have made 3 AtomGroups, which serve as selections of atoms. These selections are:
Hydrogens- The hydrogens in the systemAcceptors- The acceptor atomsDonors- The donor atoms
Distance calculations
We want to now calculate distances between hydrogens and acceptors to see who is close enough to form a hydrogen bonds. We could manipulate the position arrays in numpy, however MDAnalysis has some built in functions which are fast and do many common analysis tasks.
The first of these is distance_array. This calculates all pairwise distances between 2 arrays of positions. This therefore creates a (n x m) array from 2 arrays of length n and m.
We will pass this the positions of all our hydrogens and acceptors.
In [36]:
from MDAnalysis.core.distances import distance_array

d = distance_array(Hydrogens.positions, Acceptors.positions)

print type(d)
print d.shape
<type 'numpy.ndarray'>
(1473, 1473)
There is a slight problem however, in that naively calculating all pairwise distances neglects the fact that our system has periodic boundaries in all three dimensions. This leads to some distances being larger than is technically possible in this geometry.
In [16]:
print d.max()84.3116261931
In [28]:
print u.dimensions[ 52.23249817 52.23249817 52.23249817 90. 90. 90. ]
However we can easily take account of periodic boundaries by passing the dimensions of the system to the distance_array function!
In [132]:
d = distance_array(Hydrogens.positions, Acceptors.positions, box=u.dimensions)

print d.max()
44.8677328673
We are then interested in any pairs that are less than 4 Angstroms apart. This is easily done using numpy.where. This then creates two arrays of indices of atoms. One arrays refers to the Hydrogen indices, the other the indices of the Acceptors.
In [133]:
import numpy as np

Hidx, Aidx = np.where(d < 3.0)

print Hidx
print Aidx
[ 0 0 1 ..., 1471 1472 1472]
[ 0 1378 1 ..., 1471 1314 1472]
There’s one final complication, this has also calculated the distance between atoms that are bonded. This is visible as the diagonal of the array is consistently less than 1 Angstrom.
In [134]:
print d.diagonal()[ 0.94583419 0.94583402 0.94984229 ..., 0.94556636 0.94836715
0.94503941]
We can filter out these results by setting them to a high value, and remaking our index arrays.
Another approach would be to apply a minimum distance critera of slightly larger than a bond length ie. (1.05 < d < 3.0)
In [135]:
d[np.diag_indices_from(d)] = 100.0

Hidx, Aidx = np.where(d < 3.0)

print Hidx
print Aidx
[ 0 1 2 ..., 1470 1471 1472]
[1378 1337 202 ..., 30 1219 1314]
Recap
We’ve used distance_array to calculate the distances between all Hydrogens and Acceptors.
We then picked out the pairs from this large array which have a distance less than 3.0.
These have become the index arrays Hidx and Aidx.
Calculating the angles
Now we’ve identified Hydrogen-Acceptor pairs with a small enough distance, we want to calculate the Donor-Hydrogen-Acceptor angle. For this there is another handy function, calc_angles. This calculates the angle in radians between triplets of points.
This is essentially the same as
# Just pseudocode!
for a, b, c in zip(positions1, positions2, positions3):
angle(a, b, c)In the upcoming use, this will calculate the angle between Donors.positions[Hidx][0], Hydrogens.positions[Hidx][0] and Acceptors.positions[Aidx][0] By doing the distance calculation first, we have narrowed down the amount of angle calculations we have to do. This is good practice because trigonometry functions are typically more time consuming to perform.
In [136]:
from MDAnalysis.core.distances import calc_angles
a = calc_angles(Donors.positions[Hidx], Hydrogens.positions[Hidx], Acceptors.positions[Aidx], box=u.dimensions)
print a
print a.shape[ 3.00201938 2.77967765 2.63056268 ..., 2.82410089 2.78503334
2.94779518]
(1526,)
We now want to filter out the angles which are smaller than 130 degrees. Again numpy.where can do this
In [137]:
a_crit = np.deg2rad(130.0)
hbonds = np.where(a > a_crit)[0]
print len(hbonds)
print Hidx[hbonds]
print Aidx[hbonds]1401
[   0    1    2 ..., 1470 1471 1472]
[1378 1337  202 ...,   30 1219 1314]
So we’ve identified 1,401 hydrogen bonds in our system, which with 1,473 ethanol molecules seems reasonable. We can also see the identity of who is bonded by slicing our index arrays by the positions where the angle criteria was met.
In [138]:
print Hidx[hbonds]
print Aidx[hbonds]
[ 0 1 2 ..., 1470 1471 1472]
[1378 1337 202 ..., 30 1219 1314]
Recap
We used the index arrays and used these to calculate the angles between specific triples of atoms from our original selections. Applying a angle criteria to the resulting angles has given us the final filter for our index arrays to give the identity of all hydrogen bonds in the system.
Plotting the bonds
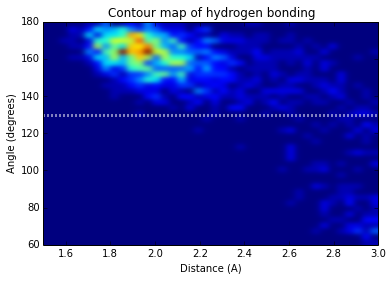
Finally, we can try and understand the hydrogen bonds better by plotting the distribution of angles and distances.
In [139]:
a = np.rad2deg(a)

histogram, xedges, yedges = np.histogram2d(d[Hidx, Aidx], a,
                                           bins=40,
                                           range=[[1.5, 3.0], [60.0, 180.0]])
print histogram
print histogram.max()
[[ 0. 0. 0. ..., 0. 0. 0.]
[ 0. 0. 0. ..., 0. 0. 0.]
[ 0. 0. 0. ..., 0. 0. 0.]
...,
[ 0. 0. 4. ..., 0. 0. 0.]
[ 1. 3. 1. ..., 0. 0. 0.]
[ 1. 0. 5. ..., 0. 0. 0.]]
23.0
In [140]:
import matplotlib.pyplot as plt
%matplotlib inline
In [142]:
# define boundaries of image
extent = [xedges[0], xedges[-1], yedges[0], yedges[-1]]
# plot the histogram
plt.cla()
plt.imshow(histogram.T, extent=extent,
           origin='lower', aspect='auto',
           interpolation='gaussian')

# plot the geometric definition of hbonds we used
plt.plot([0.0, 3.0], [130.0, 130.0], color='w', ls=':', lw=3.0)

plt.xlim((1.5, 3.0))
plt.ylim((60.0, 180.0))

plt.title('Contour map of hydrogen bonding')
plt.xlabel('Distance (A)')
plt.ylabel('Angle (degrees)')
<matplotlib.text.Text at 0xa43cafac>