Finding the equilibration point using sklearn
This post details a method for detecting equilibration of a time series using sklearn.
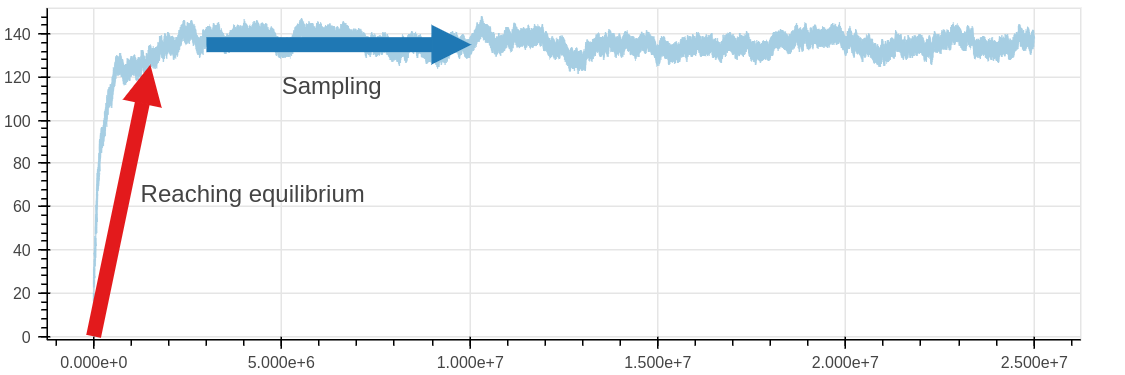
When running molecular simulation (and probably most types of numerical simulations) it is common for the results to require a period of time before they are reporting the true equilibrium values we are looking to sample. In my case I’m running a simulation of the adsorption of gas into a porous solid, initially the system isn’t at equilibrium and only after some time can I start collecting results. I needed a foolproof, quick and automated way to identify the point when the system reached equilibrium and I could start collecting results, this is illustrated below.
While this is simple to do by eye, it is suprisingly difficult to come up with a true foolproof method for doing this. The pymbar package includes a good function for doing this, (detailed in “A Simple Method for Automated Equilibration Detection in Molecular Simulations”), which attempts to find the equilibration time which would give the most usable data while minimising the RMS error. I found this method quite computationally “heavy” however, especially with longer time series, and therefore in a paper I recently published on benchmarking GCMC simulations I included a method for esimating equilibrium based upon a rolling mean of the data, and this falling below an estimation of the mean. This worked a lot faster than the function in pymbar, however it required a lot of heuristics (window size and how far below the mean to consider not at equilibrium) so I wasn’t completely happy with it.
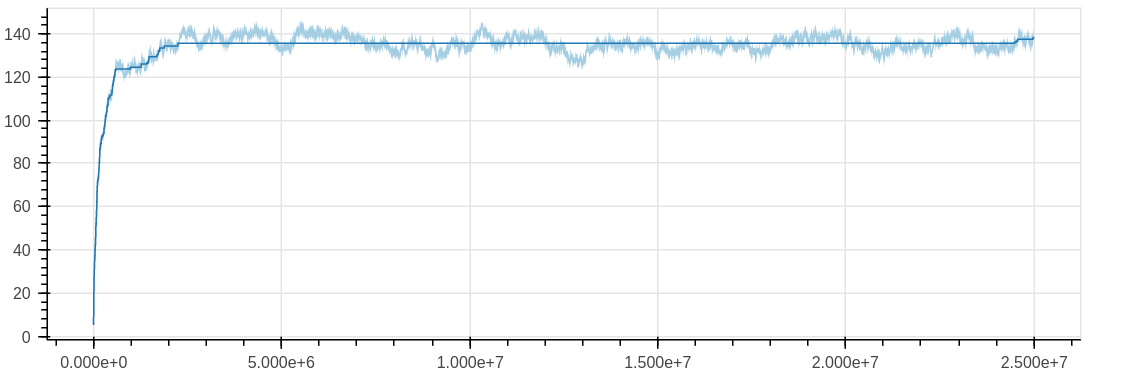
More recently I’ve been playing with the [scikit-learn][sklean] package a lot, and came across the isotonic regression model. This method fits many least squared regression lines to the data, with the condition that none of the lines can be decreasing. When considering using this for my data it seems like a good fit, my data will increase to the equilibrium value, then oscillate around the mean value exploring the range of possible values. Applying this method to my data gave the plot below, which fits the data very well, with the exception of the final portion of the data, where it drifts higher.
To remedy this, I wrote a function which estimates the mean from the tail end of the data,
and then caps the isotonic fit (using the y_max keyword) to the estimated mean of the data.
To estimate the equilibration point, we can then perform the isotonic regression,
then identify the first time that the fit reaches the mean value.
import pandas as pd
from sklearn.isotonic import IsotonicRegression


def fit_isotonic_regression(ts, rhs_portion):
	"""Fit an isotonic regression with the max y value based on rhs_portion.

	Parameters
	----------
	ts : pd.Series
	  Pandas series of the data to fit isotonic regression to
	rhs_potion : float
	  Fraction of the timeseries to use to estimate the mean of the series.
	  This fraction needs to be larger than the characteristic time of fluctuations
	  in the series.

	Returns
	-------
	iso : pd.Series
	  Series of the isotonic regression fit.
	"""
	rhs = ts.tail(int(len(ts) * rhs_portion))

	ir = IsotonicRegression(y_max=rhs.mean())

	return pd.Series(ir.fit_transform(ts.index, ts.values), index=ts.index)


def find_equilibrium(ts, rhs_portion):
	"""Find the point where the signal becomes equilibrated

	Parameters
	----------
	ts : pd.Series
	  time series to find equilibrium for
	rhs_portion : float

	Returns
	-------
	equilibrium : float
	  index of where the time series reaches equilibrium
	"""
	iso = fit_isotonic_regression(ts, rhs_portion)

	eq = iso[iso == iso.iloc[-1]].index[0]

	return eq
The results of this method are shown in the plot below, with the red shaded region being pre equilibrium. I have made the data and notebook used to produce all the plots available so you can try for yourself.